Platform on window, door, frame technology, hardware, roof and facade technology, security

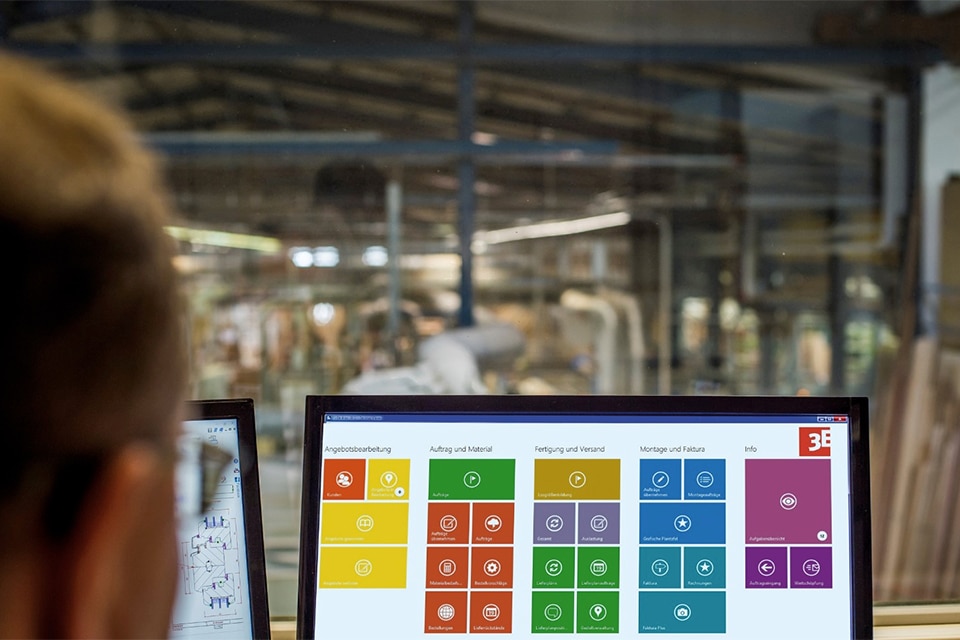
A dashboard immediately reminds us of the control panel in the car. It gives a global overview of all the functions of our vehicle. The comparison with a joinery is very relevant.
A dashboard in your joinery business is equally one clearly structured screen, which visually, with pie, line or bar charts, gives a global overview of your company's operations. It should be a clear summary of the performance indicators in "real time" of the various aspects of the business, such as, sales, production, deliveries, placement, invoicing, inventory,...
To ensure that a dashboard is clear and easy to interpret, it can also be made by department. It is interesting to visually display the deviations from the same period last year or the objectives made.
A dashboard should show the situation of the main indicators of the different areas of business operations. Some examples
● Sale
The sales data, such as quantities sold, amounts, open offers, scoring percentage, etc. are clearly displayed.
●Production
Data on the number of pieces produced per day and/or per employee and average lead time give an indication of productivity. Based on this, adjustments can then be made quickly.
●Placement
The efficiency of the installation teams is very often the weak link in the profitability of a project. The percentage difference over the last 3 months per shift between planned and realized hours gives an indication to further optimize through good planning.
●After-sales service
The evolution of the number of open follow-ups can be monitored with a possible distinction between the additional work under warranty and the paying ones.
●Financial
Key financial figures can also be displayed. We think, among other things, of the invoiced and outstanding amounts, the average number of days of credit,...
Having a clear representation of your company's operations through an easy-to-read dashboard allows you to make faster and better decisions to track, maintain and increase efficiency.
Behind, reports and figures can be requested to analyze further details.
A good operational scheduling software makes this possible.
Wondering how this can be done in practice ? Contact us no-obligation